
Price tracking and history
Read a product’s prices and history
Every product has its own page that brings all of its prices together: what you charge, what each competitor charges right now, and how those prices moved over time. This guide walks through that page from top to bottom.
Before you start
- A product with at least one link. See Add a product by hand.
Open a product
Go to Products, find the product by name or code, and press View. The same summary also appears above each product’s table in the product list.
The summary at the top
- Tracking: how many links and stores you follow for this product, how many are active, how many already have a price, and how many are in stock.
- Your price: the price on your own store’s page, if one is linked to the product.
- Price Index: Price index is a relative score vs market average — 100 means your price equals the market, below 100 means cheaper, above 100 means more expensive.
- Market · competitors in stock: the lowest and highest price among competitors that are active and in stock. Your own store is not included.
Tip No price index? It needs your own store’s page on the product. Add a link from your store, or set your store’s address first, see Change your store address and currency. The index and rank are explained in Understand your price index and price position.
Each store’s price
Below the summary, every link has its own card. Your own store is marked You.
- Latest Price: the price found on the last check, with the stock status next to it.
- Earlier prices: the most recent changes before that.
- The store name can carry a strength badge. It shows how big and established that store is. See Domain strength and ads status.
With many links, narrow the list: search by address or store, or use the filters for store, Has price / No price, and In stock / Out of stock.
The chart and full history
Open the history
Press Chart & price history on a link. In the product list, choose View history in the link’s menu instead.
Read the figures
At the top you see the Latest Price, the Minimum Price and Maximum Price in the period, and the Average Period Change.
Pick a period
When a link has a long history, choose a Time range such as 30 days or All. Only periods that hold prices are offered.
Compare with your store
If your own store’s page is on the product, the chart also draws your price. Untick Compare with to hide that line.
Go further back
The table under the chart lists each recorded price with its Old price, Change and Stock. Press Load older history to see earlier entries.
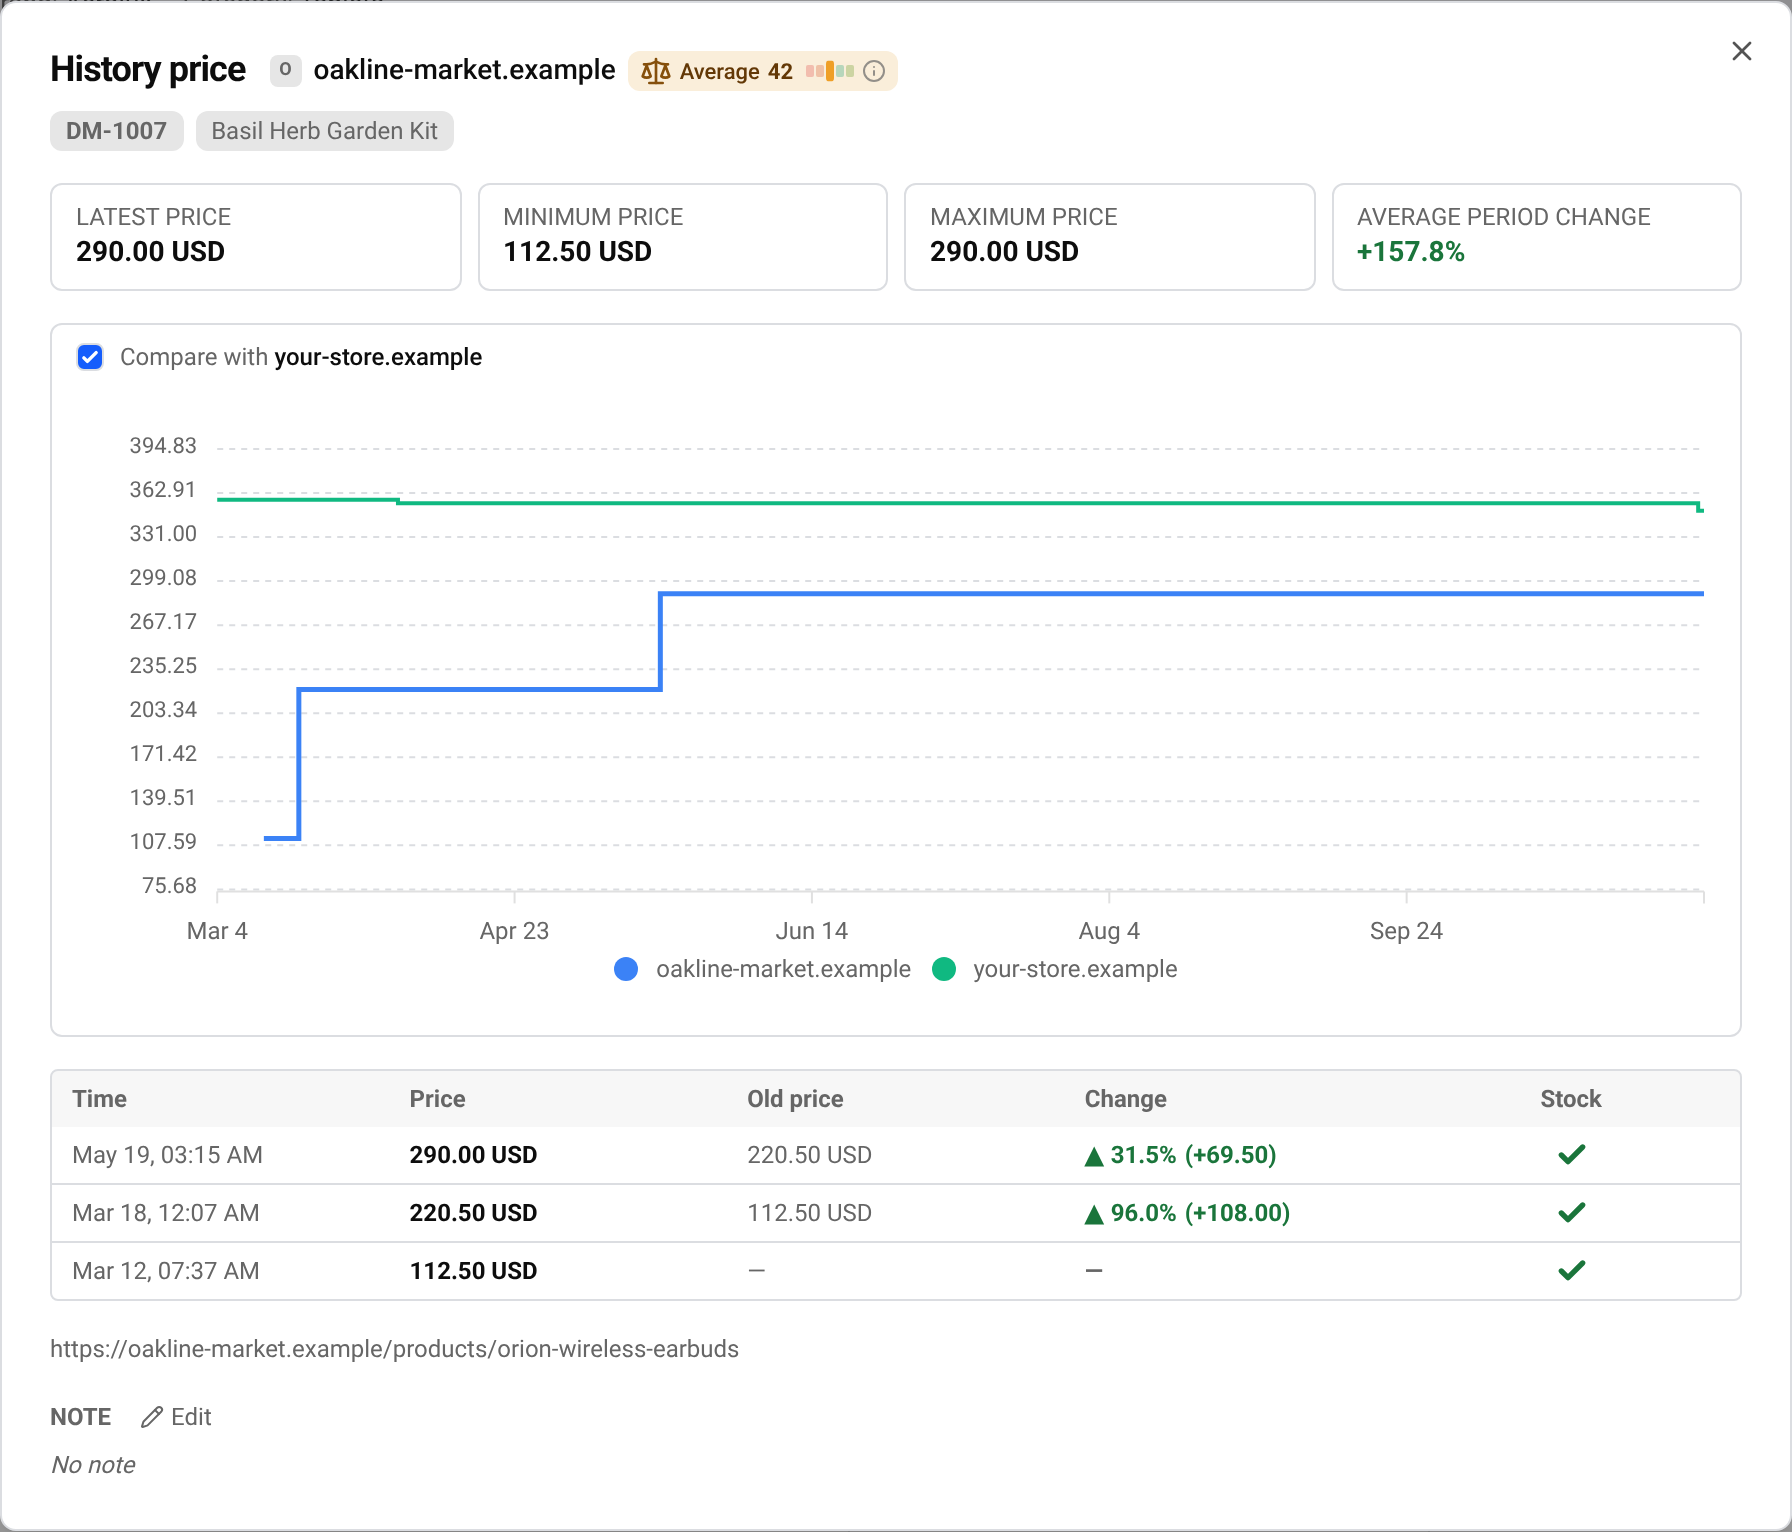
A price point is recorded whenever price, currency or stock status changes, and at least once every 7 days. So a flat line simply means the price did not change.
You can also keep a note on the link from this window. It is the same note shown on the product, see Add, pause and remove competitor links.
Prices in other currencies
Tables show each price as the store lists it. Figures that compare stores, such as the market range and the price index, use your workspace currency and convert other currencies at the latest exchange rate. In Products, the Price view menu switches the tables between Listed prices and prices converted to your currency.
If a store changed currency over time, the chart converts everything to one currency and says so above it.
Questions
Why is a store missing from the market range?
The range only counts competitors that are active, in stock and already have a price. Paused or out-of-stock links, links without a price yet and prices in a currency that cannot be converted are left out.
How far back does the history go?
Back to the first check of that link. How much of it you can open depends on your plan, see the pricing page.
Can I see every price change across all products?
Yes. See See every price change in one list.
Related guides
Still stuck?
Open Support in the app and our team will reply there. You can also email our support team; the address is at the bottom of every page.
 English
 ไทย
 Tiếng Việt
 한국어
 日本語
 简体中文
 Français
 Deutsch
 Русский
 Italiano
 Polski
 Español