
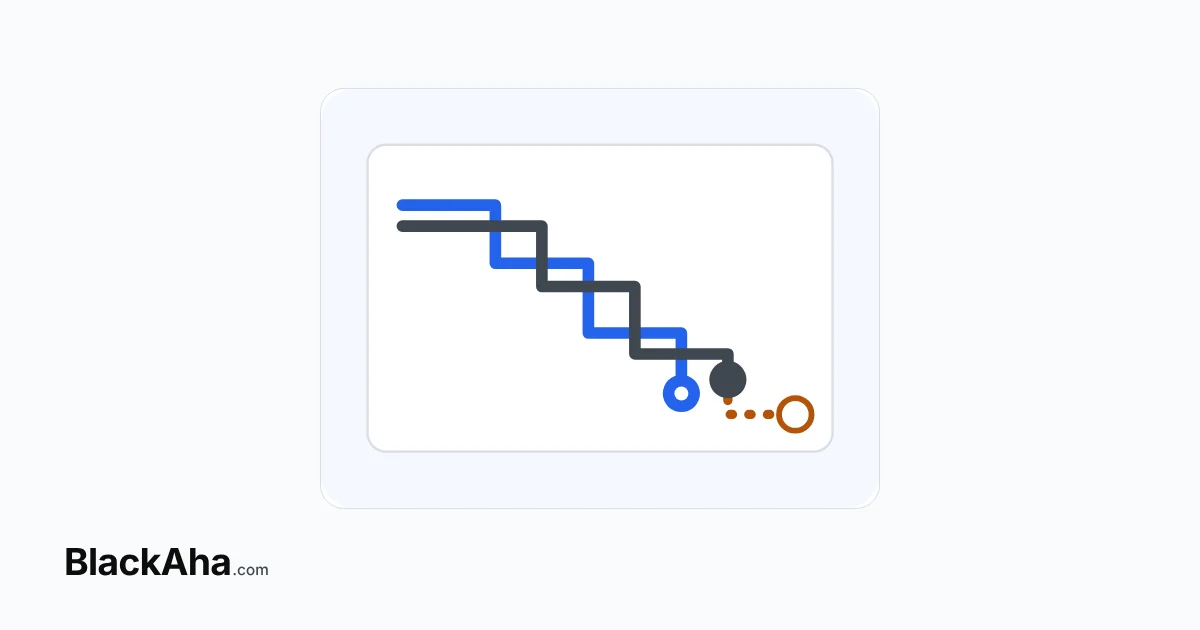
Competitor pricing behaviour patterns are the habits a rival shows on the products you both sell. Most fall into four families: they follow you, squeeze you, sit just above or below you, or lead the market. Each leaves its own shape on a price chart, and each calls for a different answer.
Prices on shared products move all the time. When two stores sell the same model, price decides much of where the buyer clicks “add to cart”. If you answer every move, you work hard and lose margin. If you know the pattern, you know which moves to ignore.
What can one product chart tell you about a rival?
More than a single price ever can. Take an illustrative example in EUR. Two online stores sell the same blender. Your regular price is €89. Over six weeks, you put both prices on one chart and read it in three parts.
Weeks 1–2: the rival copies you
You run a short promotion at €84. The rival drops to €84 the next day. When you go back to €89, they go back to €89 too. Twice in a row, your line moves first and theirs follows. That is a follower.
Weeks 3–4: the rival starts to undercut
Now the rival moves first and goes to €87. You answer at €85. Within hours they are at €83. Each time you move, they land €2 below you. A rival that keeps pricing just low enough to take the sale is squeezing you.
Weeks 5–6: the rival settles just below
You stop answering and return to €89. The rival climbs back too, but stops at €88. From then on, the gap stays at €1, whatever you do. The squeeze has turned into a steady “always a little cheaper” position.
The lesson is that a rival’s behaviour can change. Read the chart again every few weeks, not once.
Which competitor pricing behaviour patterns come up most?
Five shapes cover most cases. Use the table to name what you see, then pick a first move.
| Pattern | How it looks on the chart | What it usually means | First move |
|---|---|---|---|
| Follower | Their line copies yours, a little later | They watch you and copy cuts, and maybe rises | Test a small price rise |
| Squeeze | They drop just below you after each of your moves | They target your sales on this product | Hold a floor and compete on more than price |
| Just below | A small, steady gap under you | A fixed “you minus a little” position | Decide if that small gap really costs you sales |
| Just above | A small, steady gap over you | They trade on service, or you are underpriced | Check whether you can raise your price |
| Leader | They move first and others follow | This store sets the market price | Watch it closely and choose a stance |
Each pattern has its own guide. A follower can be an opening: see how to lead a copying rival upward. For the second pattern, read about spotting a price squeeze and stepping sideways. Steady gaps have two guides: a rival pinned just below you and rivals that sit just above you on purpose.
A price leader needs a choice: follow it closely, keep a fixed gap or price on your own. Our guide to following or keeping your distance from a market leader compares the three. If two stores keep undercutting each other in turn, see how to stop an automatic undercut loop.
How do you read a rival’s pattern from price history?
Answer four questions per rival, on products you both sell. It takes a few minutes per store once the data is tracked.
- Pick the right products. Use exact matches: same model, same size, both in stock. A cheaper bundle or an out-of-stock page tells you nothing about behaviour.
- Who moves first? Put both lines on one chart and look at the order of changes. If they nearly always move after you, they follow. If others move after them, they lead.
- How big is the gap? Note where they sit after each move. The same small gap, again and again, points to a fixed rule rather than a person deciding.
- How often do they change? A few changes a month suggests manual pricing. Several a day suggests software. That tells you how fast they will react to you.
Write the answers as one line per rival, for example “follows within a day, sits €1 below, changes often”. Our guide to building a profile of each rival from their price history gives a template. For step two in depth, see finding the price leader in your category. For step four, see counting how often each rival reprices.
Should you react to every pattern?
No. A pattern is a reason to think, not an order to cut. A follower that copies your rises is good news. A rival sitting €1 above you may be telling you that you are too cheap. Only a squeeze from a strong rival on an important product needs a fast plan.
Whatever you decide, set a price floor first. A rule that always beats a rival who always beats you ends in a price war.
How BlackAha helps
BlackAha.com tracks competitor prices for online stores and keeps the history behind each pattern. Price Comparison Charts draw your price next to each rival’s, so the order of moves is easy to see. Unlimited Price History keeps every recorded price, and the price history list can be filtered to one store to follow that rival across all your products.
My Store Price Ranking shows your price position on each product. Price Change Alerts tell you when a rival moves. When you know the pattern, Dynamic Pricing can answer one chosen store with a rule, and its guardrails, always applied last, keep the price above your floor.
Key takeaways
- Most rivals show one of five shapes on shared products: follower, squeeze, just below, just above or leader.
- Read the order of moves, the size of the gap and how often prices change, not just today’s price.
- Behaviour changes over time. In the example, one rival copied, then undercut, then settled €1 below.
- Not every pattern needs a price cut. Some are a sign you can raise your price.
- Set a floor before any automatic answer, so two rules cannot race each other down.
Frequently asked questions
How can I tell if a competitor is copying my prices?
Put both prices on one chart for the same product. If their changes nearly always come shortly after yours, in the same direction, they are following you. Check it on several products before you act.
How long should I watch a rival before naming a pattern?
Wait until you have seen several price changes from both sides, not one. A single cut can be a promotion. The same reaction three or four times in a row is a pattern.
Is a rival that always sits just below me using software?
Often, but not always. A gap that stays exactly the same and moves within hours points to an automatic rule. Slower, uneven moves usually mean someone prices by hand.
What is the biggest risk of answering a pattern automatically?
Two rules chasing each other down. If your rule beats the rival and their rule beats you, prices fall until someone stops. A floor, checked after every rule, is what stops yours.
Pick your three best sellers and one rival. Chart their prices side by side and name the pattern before your next price change. You can try BlackAha on your own products.

 English
 ไทย
 Tiếng Việt
 한국어
 日本語
 简体中文
 Français
 Deutsch
 Русский
 Italiano
 Polski
 Español