
To optimize pricing with competitor data and A/B testing, show two prices to separate customer groups for a fixed period, compare conversion rate, average order value and retention, and log competitor price changes during the test so rival moves do not distort your result.
Used strategically, competitor data can be a game changer for businesses that want to optimize pricing. An A/B pricing test built on competitor monitoring data gives insight into market dynamics, customer behavior and competitive positioning. It leads to better-informed pricing and a better customer experience, which supports engagement and sales.
How do you set up an A/B pricing test with competitor data?
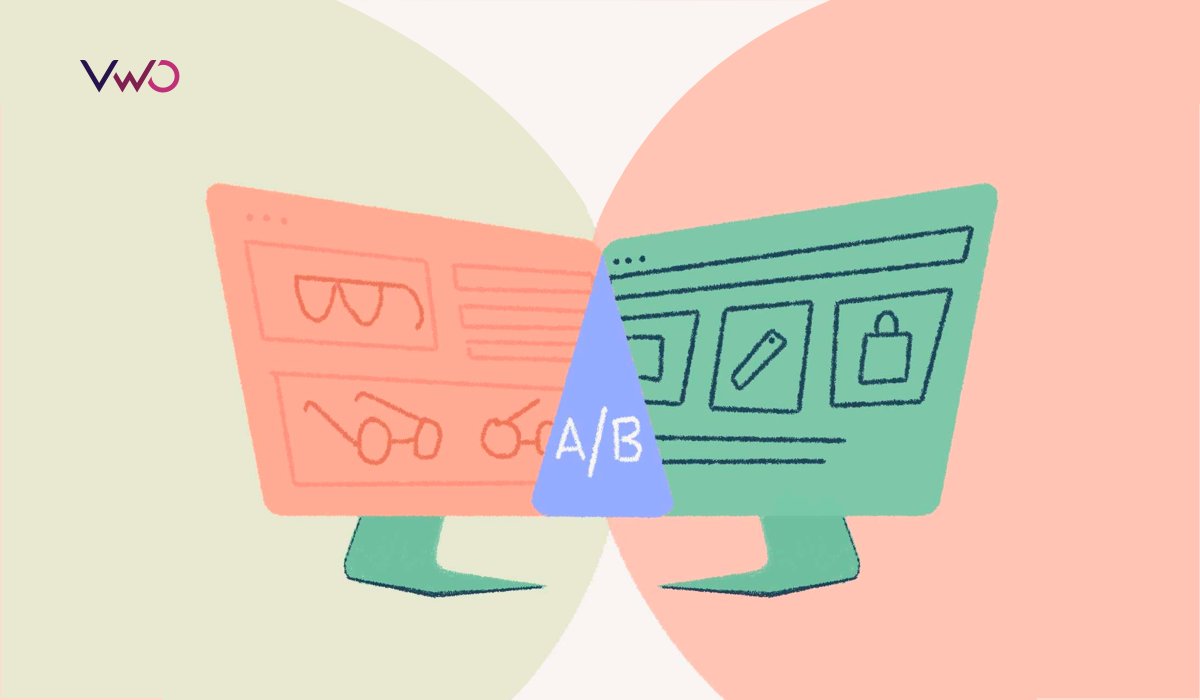
An effective A/B pricing test starts with a clear objective. For instance, a fictional ski equipment retailer wants to know whether cutting the price of a popular range of snowboards by 10% will increase overall sales compared with keeping the current price.
The retailer runs the test over a defined period, say four weeks, and splits customers into two segments. Group A sees the original price; Group B sees the 10% discounted price. Throughout the test, the retailer tracks competitor prices to catch any price changes or promotions by rivals. This way the test measures both how customers respond to the price change and how competitor actions affect their purchase decisions.
Which measurement variables should you track?

Measurement variables decide whether you can judge the effect of a test price at all. Key metrics include conversion rate, average order value and customer acquisition cost. In the ski equipment scenario, conversion rate — the number of customers who buy relative to the total who visit the site — shows how the price change affects buying decisions.
Average order value is another critical variable: it shows whether customers add more items to their carts at the lower price. Comparing these metrics with industry averages, or with competitor pricing structures, shows whether the new price is genuinely compelling.
Customer retention rate also matters and can be measured by tracking returning customers after purchase. A clear increase in repeat buyers in Group B (the lower price) suggests the price affected not just the first purchase but long-term loyalty too.
How do you analyze the results of an A/B pricing test?
In the analysis phase, the data from each measurement variable is put under scrutiny. For the ski equipment retailer, statistical methods will show whether there are significant differences between the control group and the test group.
A/B testing analysis tools can break the data down by factors such as age, location or purchase behavior. That adds context to the raw numbers — for example, it may show that one customer segment responded strongly to the price drop, which can guide targeted marketing later.
Alongside the statistics, the retailer should keep monitoring competitor pricing during the test. Élasticité-prix should be checked often, because competitors may react with their own price changes and influence customer behavior. Insights from competitor strategies give a fuller picture of market position and support well-grounded pricing decisions.
What if a competitor changes prices during the test?
Back to the ski equipment example: suppose a major competitor launches a fall sale that overlaps the testing window. Customers’ Sensibilité au prix may change suddenly because of the competing offer.
To handle unexpected variables like this, the retailer needs flexibility in both test parameters and analysis. Adding competitor price changes to the analysis — for example, comparing sales volume with the dates of competitor discounts — can produce actionable findings. Les Price Change Alerts make it easier to note exactly when a rival moved. Like a pivot in a game plan, adapting prices to current competitor data keeps them relevant and keeps customers motivated to buy.
How do competitor moves affect your test metrics?
As noted above, measurement variables are central to pricing optimization. Sales volume can shift with both your price and competitors’ actions. In the example, if sales volume in Group B (the discounted group) did not clearly exceed Group A, that may point to customer loyalty to competitors or to a gap in perceived value.
Engagement metrics from the test, such as session duration and bounce rate, also matter. Longer sessions after the price cut may mean customers are more interested in reviewing products, while a high bounce rate may mean the lower price did not resonate with the target audience.
A matrix that places your test metrics next to competitor monitoring data shows how external factors influence your internal pricing results.
How can A/B pricing results shape your strategy?
Let’s take the ski equipment retailer’s A/B pricing example further. Marketing automation tools that tag data points from both groups open new options for personalization and segmentation.
Suppose the analysis shows that Group B was more engaged after purchase. The business can then run a segmented email campaign for newly converted customers. Behavioral data can also improve product recommendations, so customers who chose the lower price are more likely to buy complementary items.
Used this way, an A/B pricing test does not just produce a temporary price — it shapes long-term brand positioning in a competitive market.
Why does competitor monitoring data matter for pricing?
Competitor monitoring data is hard to overstate. Built into your pricing strategy, it is the backbone of staying competitive and relevant in volatile markets.
With tools that track and analyze competitor prices along with seasonal trends, the ski equipment retailer can adjust its positioning as the market moves. This data helps businesses anticipate competitor moves, respond promptly and strengthen their market position.
Using competitor data also comes with ethical responsibilities. While staying informed about rivals’ prices, businesses should avoid Prix prédateurs or flooding the market with aggressive markdowns that could damage the perceived value of the whole category.
Businesses that combine competitor data with A/B pricing tests gain valuable insight into customer behavior, market dynamics and customer expectations. Bringing analytics and competitor monitoring together drives sales now and supports long-term success through well-targeted customer engagement — a more responsive, agile and customer-centric pricing model.
Conclusion
Optimizing prices with an A/B test based on competitor monitoring data takes more than collecting and analyzing data; it takes a clear understanding of how the market works. Focusing on the right measurement variables and careful analysis, while using competitor data, lets businesses adapt their pricing proactively so it resonates with their customers and stays competitive.
À retenir
- Start an A/B pricing test with one clear objective, two customer groups and a fixed test period.
- Track conversion rate, average order value, customer acquisition cost and retention for each group.
- Monitor competitor prices throughout the test, because rival promotions can distort the result.
- Use statistical analysis and segment breakdowns before deciding which price wins.
- Avoid predatory pricing and aggressive markdowns that harm the category’s perceived value.
Questions fréquentes
What is an A/B pricing test?
An A/B pricing test shows two different prices to two customer groups over the same period and compares results such as conversion rate and average order value to see which price performs better.
Why include competitor data in an A/B pricing test?
Competitors may change prices or run promotions during your test. Tracking those moves helps you tell whether a result came from your price or from a rival’s action.
Which metrics should I measure in a pricing test?
Key metrics are conversion rate, average order value, customer acquisition cost and customer retention, plus engagement signals such as session duration and bounce rate.
What should I do if a competitor launches a sale during my test?
Record when the competitor’s sale started and ended and compare your sales volume with those dates, so you can account for the overlap in your analysis.
 English
 ไทย
 Tiếng Việt
 한국어
 日本語
 简体中文
 Français
 Deutsch
 Русский
 Italiano
 Polski
 Español